


Crawl Stats Report Overview
The Crawl Stats report is one of the most valuable sections of Google Search Console, yet it’s surprisingly hidden behind a Settings menu where you would never typically think to look.
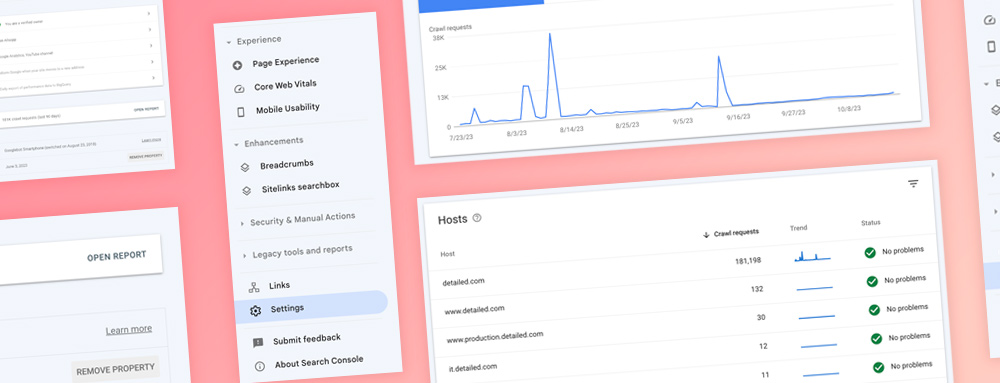
If you log in to Google Search Console, head to Settings on the left menu, then Crawl Stats. It should look something like this:
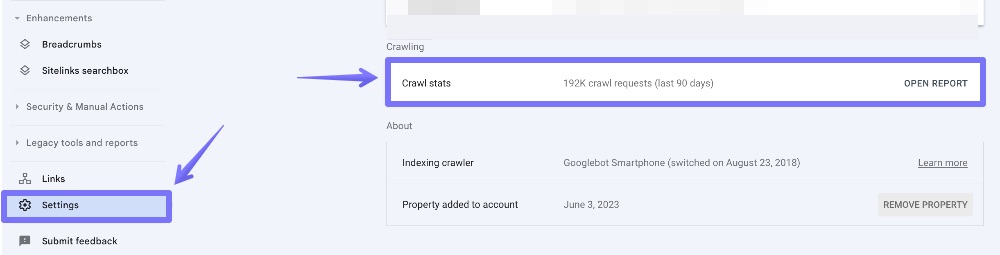
Once you’ve opened the report, the first thing you’ll be greeted with is:
- Total crawl requests
- Total download size (in Bytes)
- Average response time (in milliseconds)
That overview will look something like this:
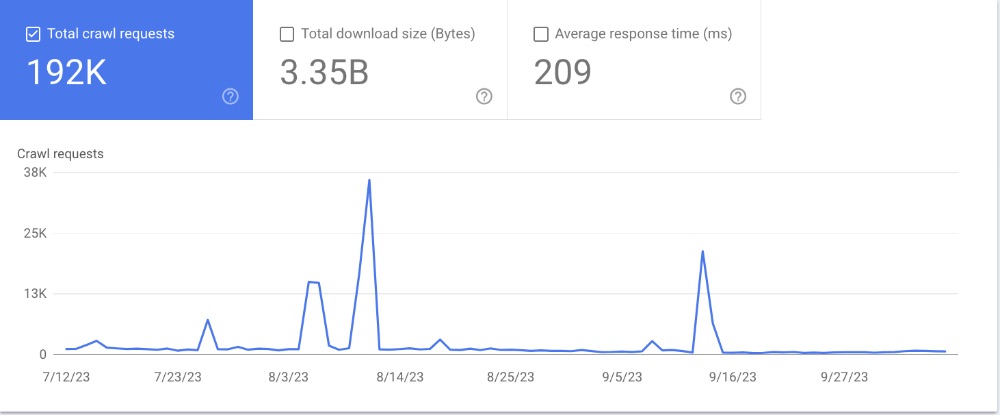
Even if you have a small website, the number of total crawl requests over the past three months is still likely a very high number, in the hundreds of thousands or even hundreds of millions.
This number can include Google looking at the same URL multiple times.
Five Actionable Insights from the Crawl Stats Report
Now that you know what it is and where to find it, let’s get some actionable insights.
#1
Look for Any Unexpected ‘Hosts’
Even if you’re analysing your own website that you typically know inside out, you may find some surprises in the ‘Hosts’ section of the report.
Perhaps you used software in the past on a subdomain and forgot to remove all files present, or a developer set up a staging website to test changes before they went live on your public-facing site.
That was the case in the past for Detailed, where someone set up a production subdomain without my knowledge or approval.
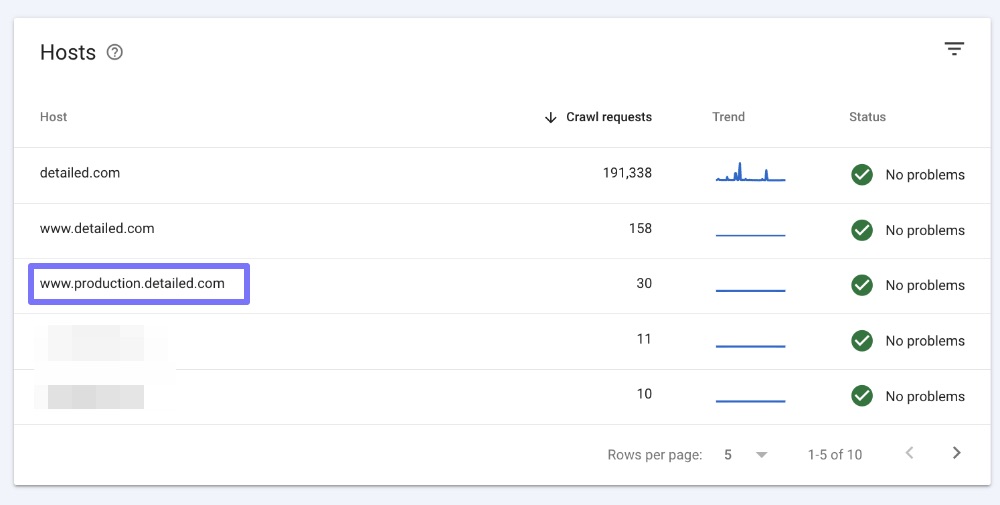
I found out about it through other means, but the Hosts card in the Crawl Stats report is one way I could have noticed something like this.
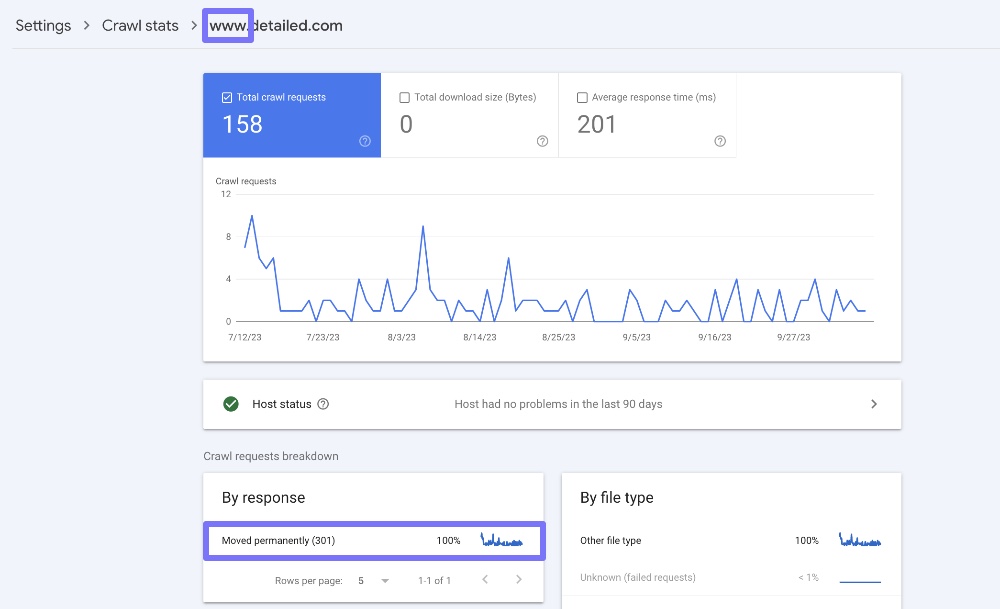
You can click through to each of these if anything is odd.
For instance, we load our site without www (https://detailed.com) on Detailed, yet I can see the ‘www’ host in this report.
From here, I would click through to see if there’s anything odd that Google is crawling and indexing because that shouldn’t be the case.
Fortunately for Detailed, all URLs found here are already being redirected:
If this weren’t the case, I would dive into the specific URLs Google is crawling and see if there’s anything I need to redirect.
#2
Use ‘By Response’ to Find Any Issues, Quickly
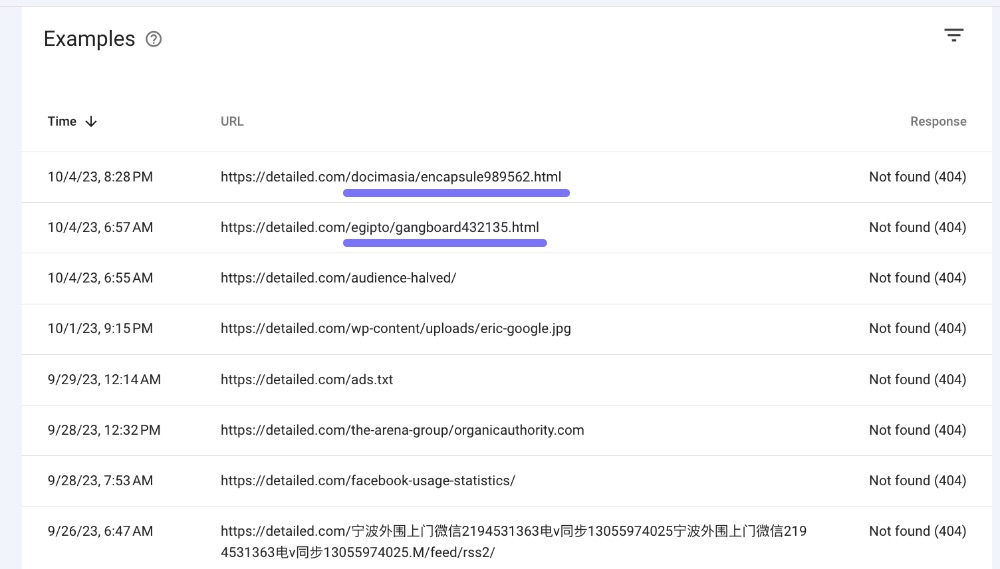
The By response report can be incredibly useful for finding pages which no longer load and are perhaps still being linked to.
It’s also useful to find pages that are giving a server error and may have something broken on them.
You can see from the screenshot below that a considerable percentage of what Google crawls on Detailed is pages that no longer exist.
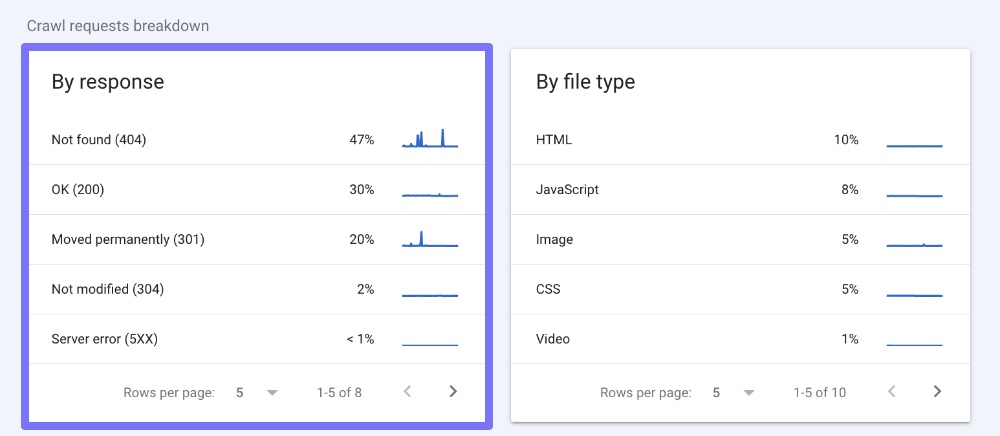
This isn’t typical.
On most websites you will see OK (200) as the response type with the highest percentage of hits.
This number is so high on Detailed because another site on the same server was hacked, and Detailed was impacted along with that.
The automated tools used created tens of thousands of pages on this site. While we removed these within hours of it happening, the damage was done, and Google picked up on them quickly.
In time, Google should be crawling these pages less frequently, so I want these to be marked with a 404 (or 410) status code. It just might take a while.
#3
Use By File Type > HTML to Get a New Perspective on Your Site
Here at Detailed we’ve worked with some of the most popular brands on the web to help with their SEO.
One thing I always advocate to our team is that you must spend time looking at a website manually rather than just through tools like Google Search Console or Screaming Frog.
One problem with using a single tool or angle to analyse a website is that it’s easy to get trapped in a narrow view of what type of pages and content exists there.
Suppose you’re auditing a blog, for example. In that case, it can be easy to focus on blog posts, category pages and tag pages and ignore that the site owner might have various non-Wordpress pages set up for things like email capture (squeeze pages).
To get another perspective on a website, I like going through the By file type > HTML report:
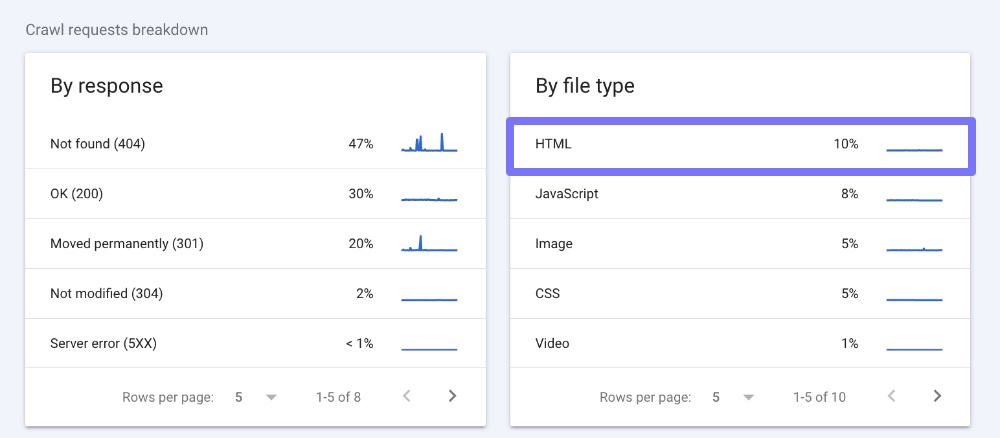
It’s not necessarily what’s in this report, but that your attention is given to URLs in no logical order.
The most recent report for Detailed looks like this:
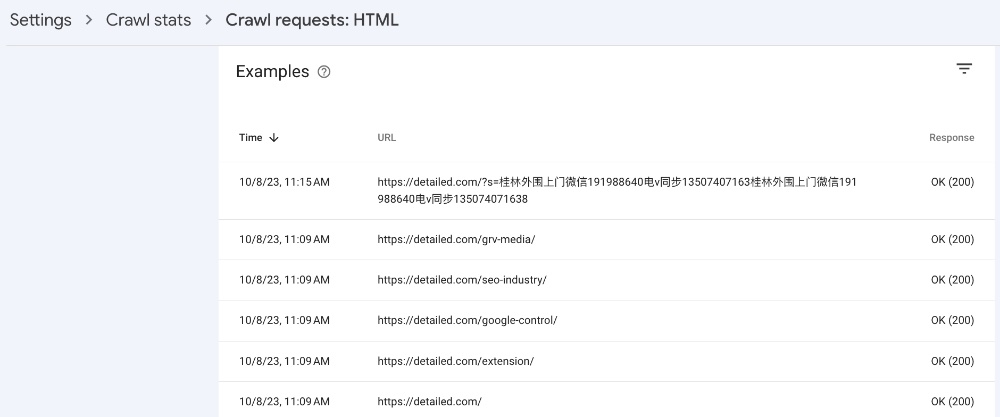
The first thing you notice is that somewhere on the web, people have been linking to spammy search results using the WordPress search functionality.
If you use a plugin like Yoast SEO then these are set to “noindex, nofollow” automatically.
If you want to block searching entirely, there are WordPress plugins available for that.
The thing about the other URLs on the list is that they are not the same type of page whatsoever.
The first has a custom page style within WordPress, two are standard blog posts, and then /extension/ is a custom landing page built outside of WordPress.
#4
Match Up Crawl Spikes with Potential Issues
It’s unlikely your overall crawl stats will be a flat line. You’ll see spikes, but sometimes these are extreme.
Whenever you see a significant spike in crawling, see if you can match it to one of the smaller graphs to help you diagnose where that might be coming from.
In the case of Detailed, that could be linked to one of a few places:
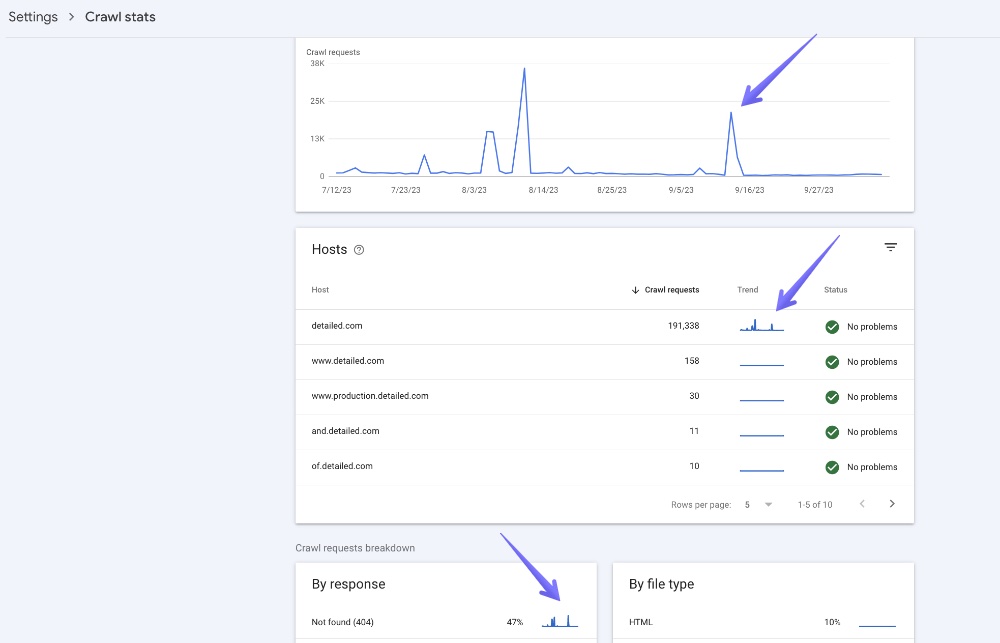
From there, I would go to each chart and see if there’s anything abnormal or concerning, like lots of spammy pages which have been added to a site.
For one client, we noticed a massive spike of millions of crawls out of nowhere, which was linked to the cache on our JavaScript files expiring.
#5
Export Rows to Look At Them in More Detail
While prevalent across much of Google Search Console, it’s nice to be able to Export part of the data you find in the Crawl Stats report for additional analysis.
To do this, you can open any section, such as ‘Crawl requests: OK (200)’ and click on the Export option in the top-right of the page, as shown below:
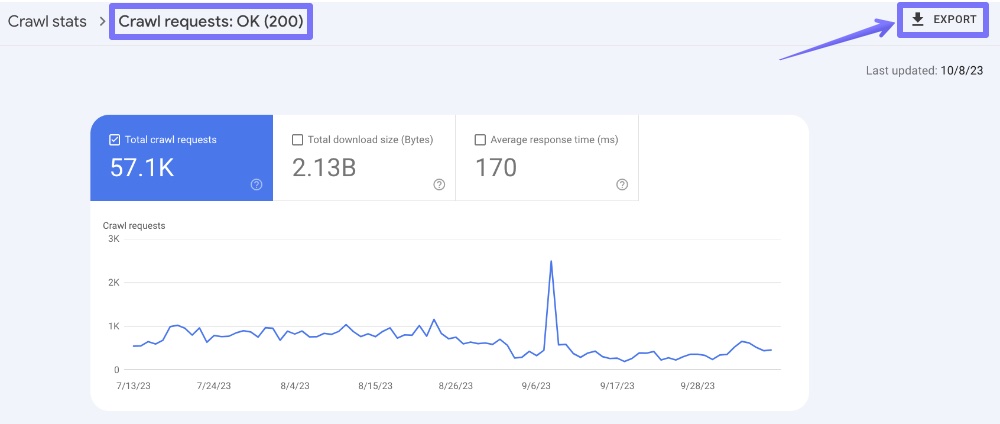
From here, you can open the data in something like Microsoft Excel or Google Sheets to perform more analysis. For example, you can quickly remove duplicates or find the URLs which show up the most often.
Without sounding like a broken record (hopefully), this also gives another perspective on your site and might highlight some sections that “stand out” and you hadn’t noticed earlier. This is especially useful if you’re working on a client website and have yet to see the entirety of it.